Road/Rail Freight
Contents
21. Road/Rail Freight#
Million tonne-kilometres by Year
Data Source: ITF (2020), https://data.oecd.org/transport/freight-transport.htm
Annual data for million tonne-kilometers
import pandas as pd
import missingno as msno
import matplotlib.pyplot as plt
import seaborn as sns;sns.set()
!ls assets
DP_LIVE_17052020151422582.csv		   eurostats_load_19_com.csv
ITF_GOODS_TRANSPORT_17052020153611120.csv  export
ITF_INV-MTN_DATA_17052020174930980.csv	   ocean-freight-infra
airfreight-infra			   road-freight-eurostats
Load Data
df =pd.read_csv('assets/DP_LIVE_17052020151422582.csv')
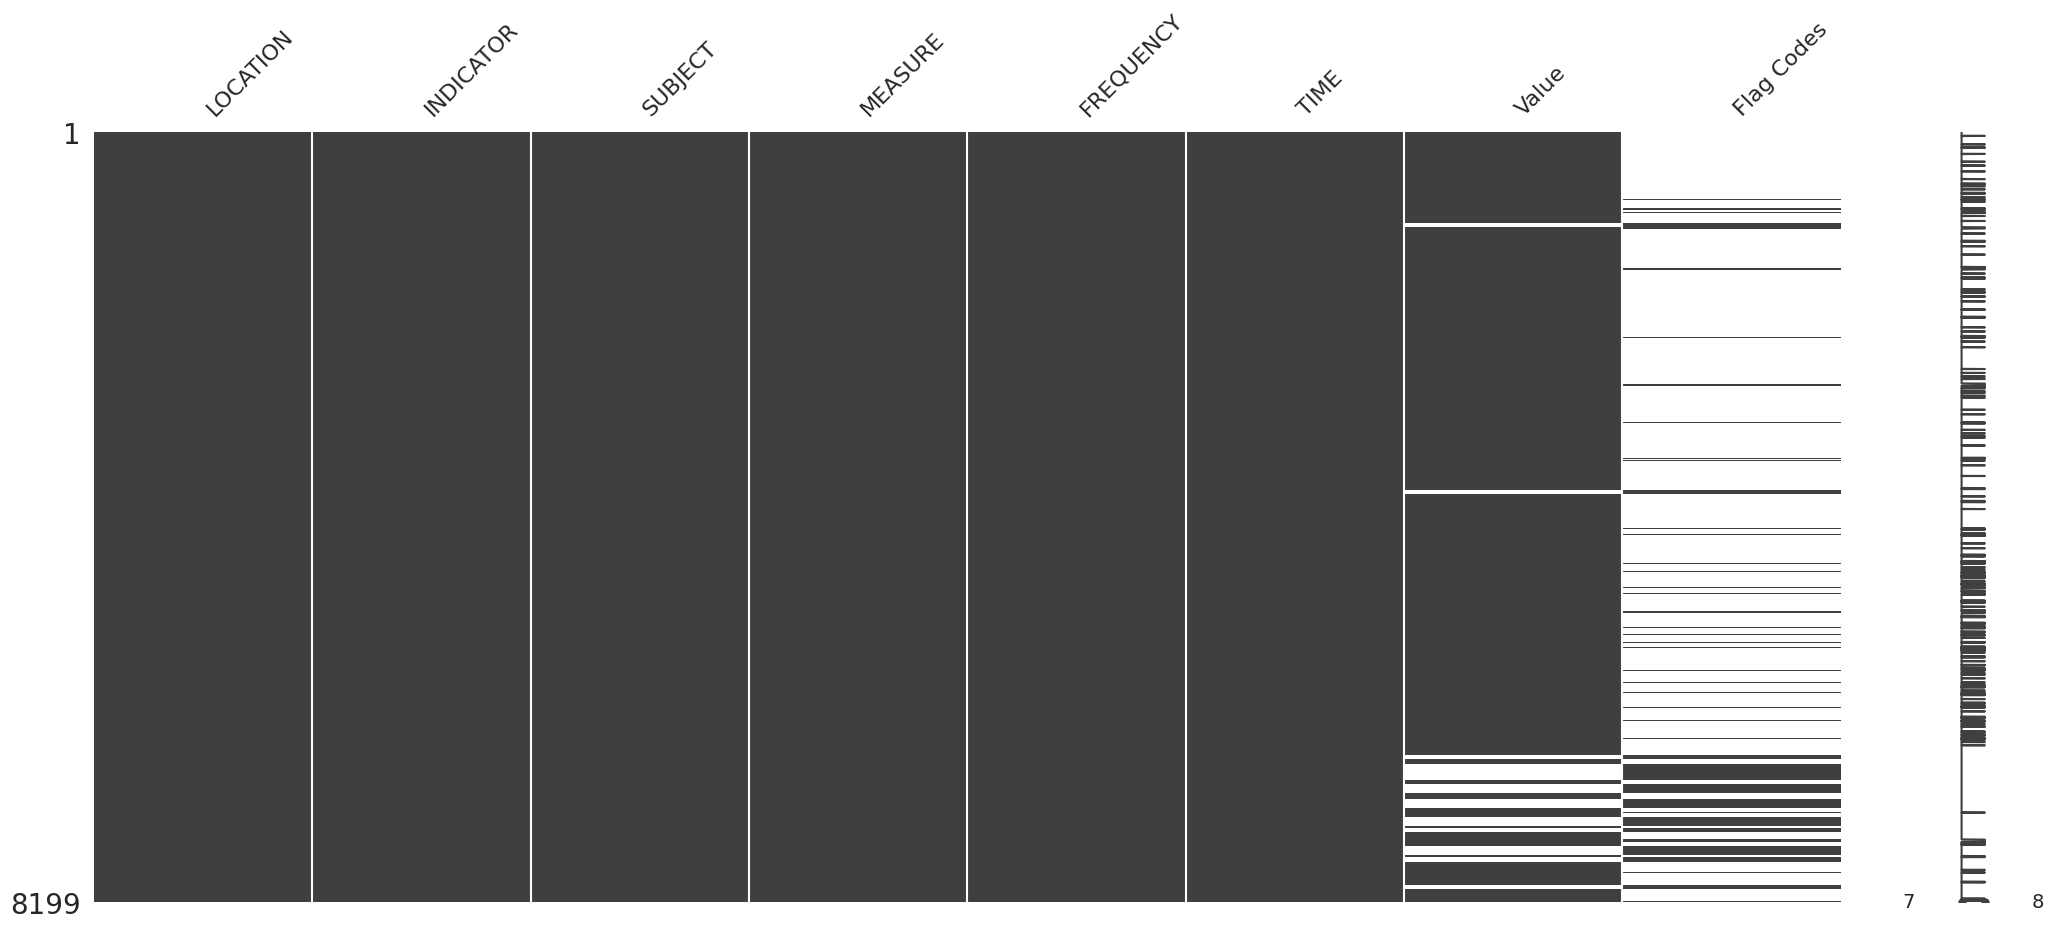
22. Data Quality#
msno.matrix(df)
<AxesSubplot:>

Flag codes indicates:
    1. B: Break
    2. E: Estimated value
    3. P: Provisional value
df["Flag Codes"].unique()
array([nan, 'E', 'B', 'P', 'M'], dtype=object)
df.head()
| LOCATION | INDICATOR | SUBJECT | MEASURE | FREQUENCY | TIME | Value | Flag Codes | |
|---|---|---|---|---|---|---|---|---|
| 0 | AUS | FREIGHTTRANSP | RAIL | MLN_TONNEKM | A | 1970 | 36006.0 | NaN |
| 1 | AUS | FREIGHTTRANSP | RAIL | MLN_TONNEKM | A | 1971 | 39704.0 | NaN |
| 2 | AUS | FREIGHTTRANSP | RAIL | MLN_TONNEKM | A | 1972 | 42661.0 | NaN |
| 3 | AUS | FREIGHTTRANSP | RAIL | MLN_TONNEKM | A | 1973 | 46711.0 | NaN |
| 4 | AUS | FREIGHTTRANSP | RAIL | MLN_TONNEKM | A | 1974 | 54075.0 | NaN |
Check the columns
df.LOCATION.unique()
array(['AUS', 'AUT', 'BEL', 'CAN', 'CZE', 'DNK', 'FIN', 'FRA', 'DEU',
       'GRC', 'HUN', 'ISL', 'IRL', 'ITA', 'JPN', 'KOR', 'LUX', 'MEX',
       'NLD', 'NZL', 'NOR', 'POL', 'PRT', 'SVK', 'ESP', 'SWE', 'CHE',
       'TUR', 'GBR', 'USA', 'ALB', 'ARM', 'AZE', 'BLR', 'BIH', 'BGR',
       'CHN', 'HRV', 'EST', 'GEO', 'IND', 'LVA', 'LIE', 'LTU', 'MKD',
       'MLT', 'MDA', 'ROU', 'RUS', 'SVN', 'UKR', 'SRB', 'MNE', 'ISR',
       'ARG', 'KAZ', 'CHL', 'ARE'], dtype=object)
df.INDICATOR.unique()
array(['FREIGHTTRANSP'], dtype=object)
df.SUBJECT.unique()
array(['RAIL', 'ROAD', 'INLAND', 'COAST'], dtype=object)
df.MEASURE.unique()
array(['MLN_TONNEKM'], dtype=object)
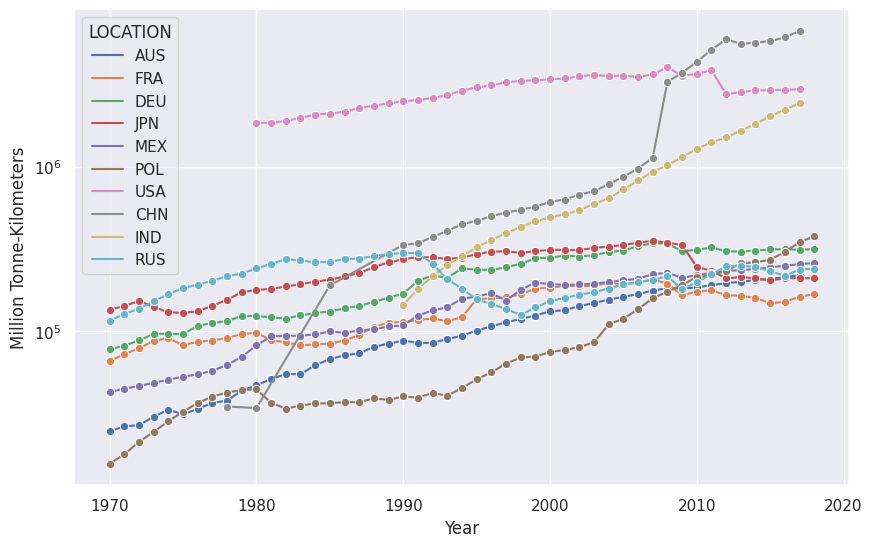
23. Road Freight Time Series#
fig, ax = plt.subplots(figsize=(10,6.18))

df_rf = df.loc[
    (
        df.SUBJECT == 'ROAD'
    ) & (
        df.LOCATION.isin(
            df.groupby('LOCATION').sum().Value.sort_values().tail(10).index
        )
    )
]

sns.lineplot(
    x='TIME',
    y='Value',
    data=df_rf,
    hue='LOCATION',
    marker='o'
)

ax.set_yscale('log')
ax.set_ylabel('Million Tonne-Kilometers')
ax.set_xlabel('Year')
/tmp/ipykernel_2550/3688438137.py:8: FutureWarning: The default value of numeric_only in DataFrameGroupBy.sum is deprecated. In a future version, numeric_only will default to False. Either specify numeric_only or select only columns which should be valid for the function.
  df.groupby('LOCATION').sum().Value.sort_values().tail(10).index
Text(0.5, 0, 'Year')

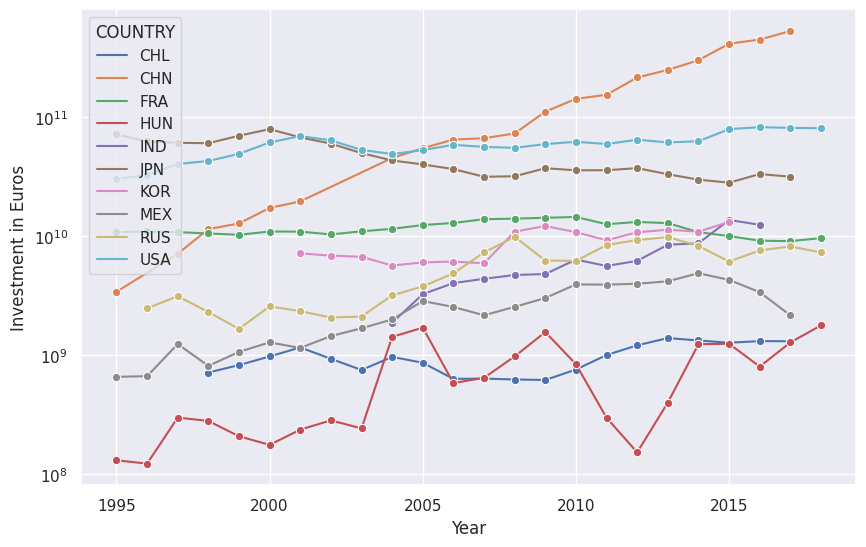
24. Investments#
road_infra_investment_data_path = "assets/ITF_INV-MTN_DATA_17052020174930980.csv"
df_invest = pd.read_csv(road_infra_investment_data_path)
df_invest.head()
| COUNTRY | Country | VARIABLE | Variable | MEASURE | Measure | YEAR | Year | Unit Code | Unit | PowerCode Code | PowerCode | Reference Period Code | Reference Period | Value | Flag Codes | Flags | |
|---|---|---|---|---|---|---|---|---|---|---|---|---|---|---|---|---|---|
| 0 | ALB | Albania | I-INV-TOT-INLD | Total inland transport infrastructure investment | NAT | National currency | 1996 | 1996 | ALL | Lek | 0 | Units | NaN | NaN | 2.402000e+09 | NaN | NaN |
| 1 | ALB | Albania | I-INV-TOT-INLD | Total inland transport infrastructure investment | NAT | National currency | 1997 | 1997 | ALL | Lek | 0 | Units | NaN | NaN | 2.441000e+09 | NaN | NaN |
| 2 | ALB | Albania | I-INV-TOT-INLD | Total inland transport infrastructure investment | NAT | National currency | 1998 | 1998 | ALL | Lek | 0 | Units | NaN | NaN | 4.765000e+09 | NaN | NaN |
| 3 | ALB | Albania | I-INV-TOT-INLD | Total inland transport infrastructure investment | NAT | National currency | 1999 | 1999 | ALL | Lek | 0 | Units | NaN | NaN | 1.099700e+10 | NaN | NaN |
| 4 | ALB | Albania | I-INV-TOT-INLD | Total inland transport infrastructure investment | NAT | National currency | 2000 | 2000 | ALL | Lek | 0 | Units | NaN | NaN | 1.464200e+10 | NaN | NaN |
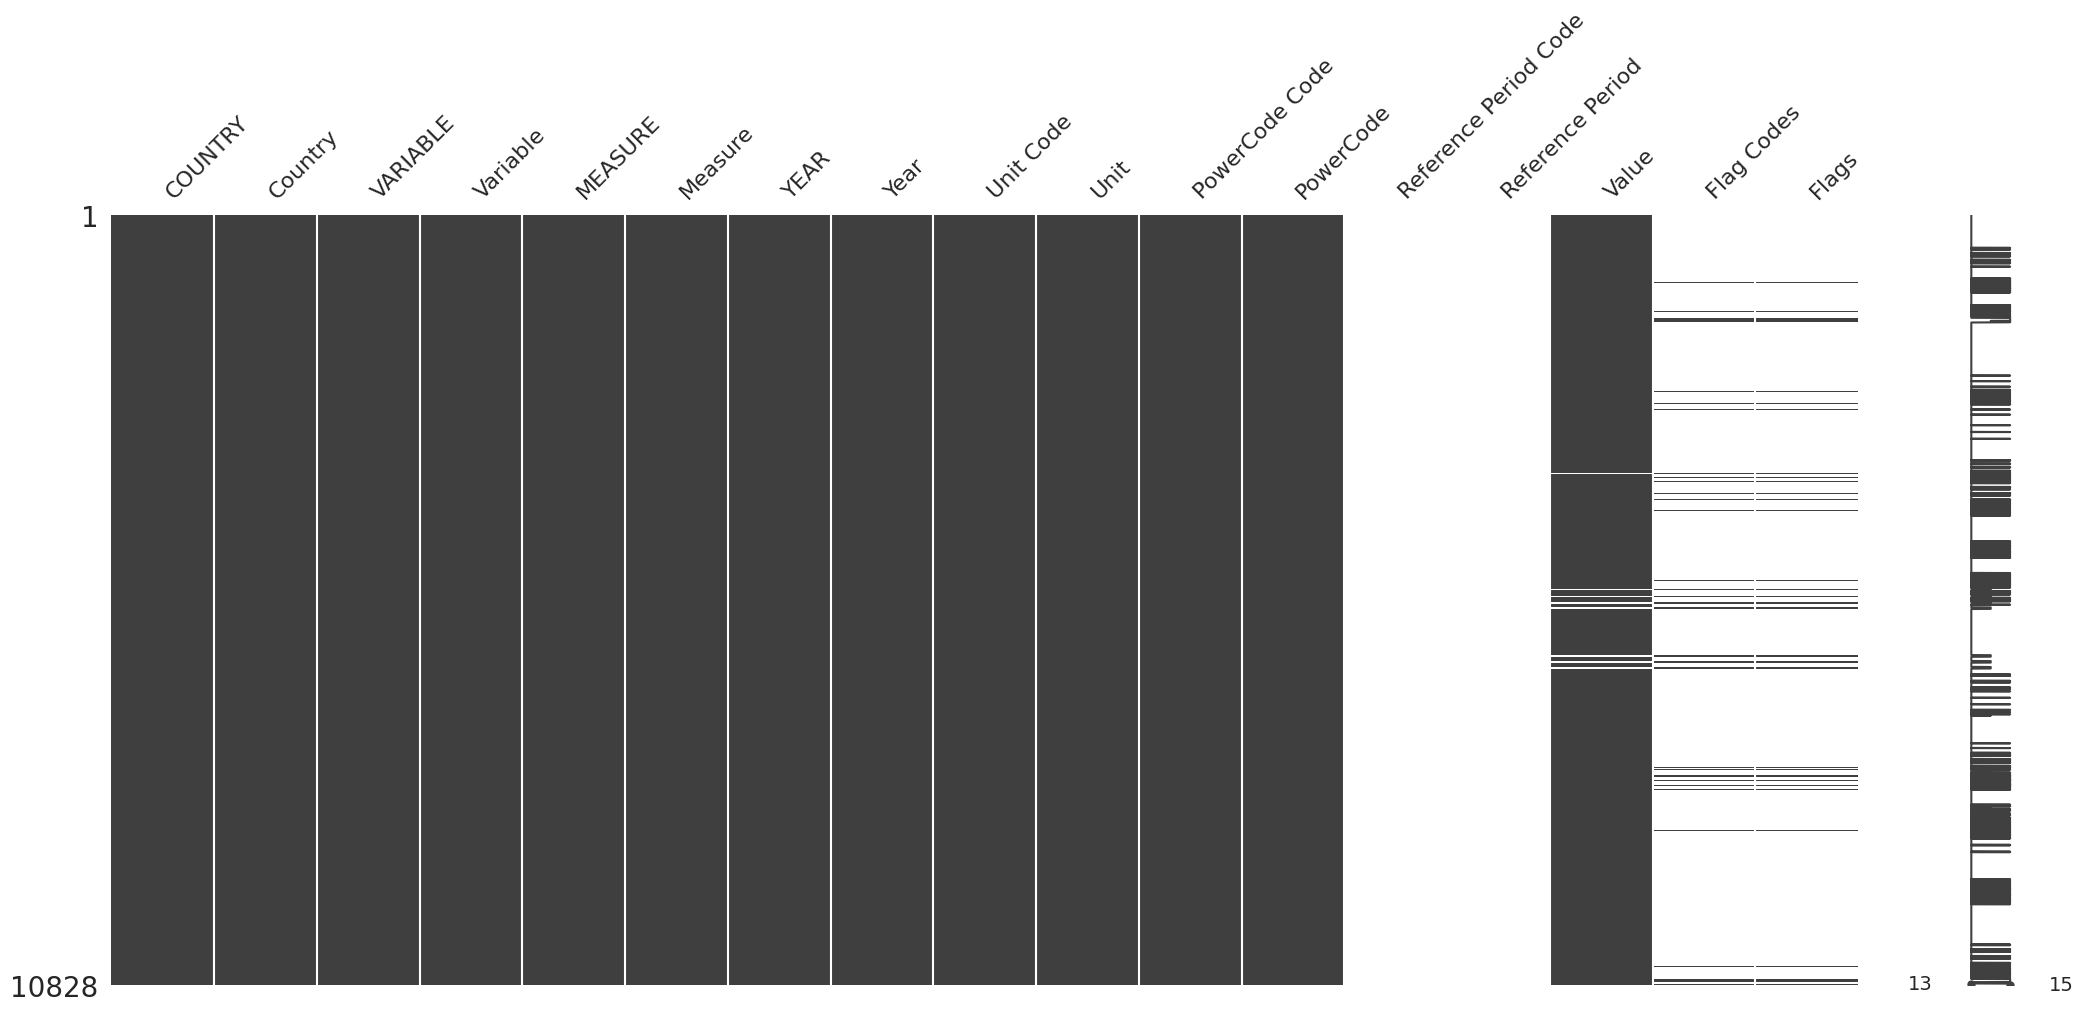
msno.matrix(df_invest)
<AxesSubplot:>

Check data quality
df_invest.VARIABLE.value_counts()
I-INV-RD          3341
I-INV-TOT-INLD    3042
I-INV-MTN-RD      2713
I-INV-RD-MOTW     1732
Name: VARIABLE, dtype: int64
df_invest.MEASURE.value_counts()
NAT          3644
EUR_CONST    3598
EUR          3586
Name: MEASURE, dtype: int64
df_invest_ri = df_invest.loc[
    (
        df_invest.VARIABLE == 'I-INV-RD'
    ) & (
        df_invest.MEASURE == 'EUR'
    ) & (
        df_invest.COUNTRY.isin(
            df_invest.groupby('COUNTRY').sum().Value.sort_values().tail(10).index
        )
    )
]
/tmp/ipykernel_2550/1014484328.py:8: FutureWarning: The default value of numeric_only in DataFrameGroupBy.sum is deprecated. In a future version, numeric_only will default to False. Either specify numeric_only or select only columns which should be valid for the function.
  df_invest.groupby('COUNTRY').sum().Value.sort_values().tail(10).index
fig, ax = plt.subplots(figsize=(10,6.18))

sns.lineplot(
    x='YEAR',
    y='Value',
    data=df_invest_ri,
    hue='COUNTRY',
    marker='o'
)

ax.set_yscale('log')
ax.set_ylabel('Investment in Euros')
ax.set_xlabel('Year')
Text(0.5, 0, 'Year')


