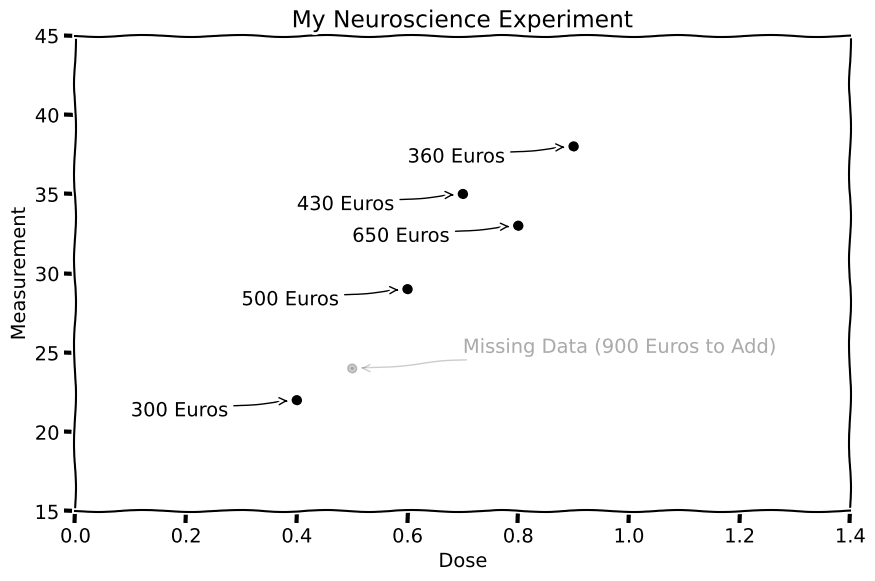
with plt.xkcd():
    # Based on "The Data So Far" from XKCD by Randall Monroe
    # http://xkcd.com/373/

    fig,ax = plt.subplots( figsize=(10,6.18) )

    ax.plot( data[0], data[1], 'ko' )
    ax.plot( [0.5], [24], 'ko', alpha=0.2 )

    ax.set_xlim([0,1.4])
    ax.set_ylim([15,45])

    for i in np.arange(0,5):
        plt.annotate(label[i], xy=( data[0][i] -0.01, data[1][i] ), arrowprops=dict(arrowstyle='->'), xytext=( data[0][i] -0.3, data[1][i] - 1 ) )

    plt.annotate( 'Missing Data (900 Euros to Add)', xy=( 0.5+0.01, 24 ), arrowprops=dict(arrowstyle='->', alpha=0.2), xytext=( 0.7, 25 )  , alpha = 0.2)

    #plt.annotate('Germany', xy=(0.4, 80.8), arrowprops=dict(arrowstyle='->'), xytext=(104, 79))

    plt.title("My Neuroscience Experiment")

    ax.set_xlabel('Dose')
    ax.set_ylabel('Measurement')

    fig.text(
        0.5, -0.05,
        '',
        ha='center')

    #ax.margin([0.5, 0.5, 0.5, 0.5])

plt.show()


