
Data Analysis for BiliDash
Contents
74. Data Analysis for BiliDash#
This notebook serves the premilinary data analysis and probing (description phase) of the bilidash data.
74.1. Time Series Data of UUPERS Account on bilibili.com#
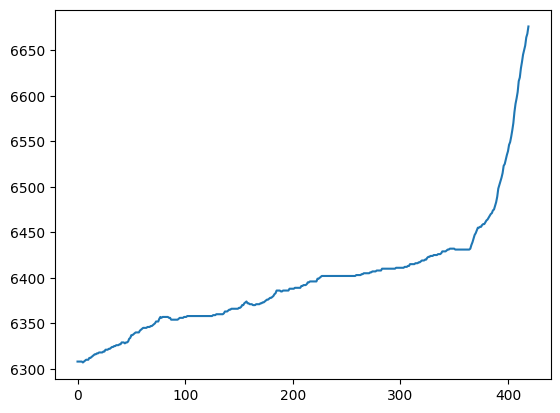
I have been tracking the data for info about number of fans, number of view, coins etc.
74.1.1. Correlation between Video Views and Fans#
There will definitely be conversion from views of video to number of fans. With the time series data, I can find out the correlation.
The first idea is that the slope of views and the slope of fans must be related.
import numpy as np
import matplotlib.pyplot as plt
import pandas as pd
import datetime

from pathlib import Path
%%bash
ls data
21768006.csv
22755224.csv
uupers.csv
# path = "data/"
# path = "http://dynamic.imresear.ch/server/track-data/uupers/"
path = Path("data")
uupers = "uupers.csv"
vids = ["21768006.csv", "22755224.csv"]
df_uupers = pd.read_csv( path / uupers)
df_vid1 = pd.read_csv(path / vids[0])
df_vid2 = pd.read_csv(path / vids[1])
def str2dt(str):
    """
    converts string to datetime object
    """

    temp_dt = [int(i) for i in ('2018-5-5-1-48-9').split('-')]
    return datetime.datetime( temp_dt[0], temp_dt[1], temp_dt[2], temp_dt[3], temp_dt[4] )


df_uupers['dt'] = [ str2dt(i) for i in df_uupers['dt'] ]
df_vid1['dt'] = [ str2dt(i) for i in df_vid1['dt'] ]
df_vid2['dt'] = [ str2dt(i) for i in df_vid2['dt'] ]
df_uupers = df_uupers.set_index('dt').reset_index()
df_vid1 = df_vid1.set_index('dt').reset_index()
df_vid2 = df_vid2.set_index('dt').reset_index()
plt.plot(df_uupers[' fans'])
[<matplotlib.lines.Line2D at 0x7fda469f4e80>]
df_vid1.columns
Index(['dt', 'view', 'danmaku', 'reply', 'favorite', 'coin', 'share',
       'now_rank', 'his_rank', 'no_reprint', 'copyright'],
      dtype='object')
total_views = df_vid1['view'].values + df_vid2['view'].values
total_coins = df_vid1['coin'].values + df_vid2['coin'].values
df_vid_tv = pd.DataFrame({"dt": df_vid1['dt'].values,"view":total_views, "coin":total_coins})
df_vid_tv['dt'].head(4)
0   2018-05-05 01:48:00
1   2018-05-05 01:48:00
2   2018-05-05 01:48:00
3   2018-05-05 01:48:00
Name: dt, dtype: datetime64[ns]
df_uupers['dt'].head(4)
0   2018-05-05 01:48:00
1   2018-05-05 01:48:00
2   2018-05-05 01:48:00
3   2018-05-05 01:48:00
Name: dt, dtype: datetime64[ns]
df_uupers.columns
Index(['dt', ' fans'], dtype='object')
df_vid_tv_slope = ( (df_vid_tv['view'].values)[1:] - (df_vid_tv['view'].values)[:-1] )
df_vid_tc_slope = ( (df_vid_tv['coin'].values)[1:] - (df_vid_tv['coin'].values)[:-1] )
df_uupers_slope = ( (df_uupers[' fans'].values)[1:] - (df_uupers[' fans'].values)[:-1] )
ratio_f = 20
ratio_c = 10

plt.figure(figsize=(10,4))
plt.plot( df_vid_tv_slope, 'k-', label='views' )
plt.plot( df_vid_tc_slope * ratio_c, 'b-.', label='coins'+'*'+str(ratio_c) )
plt.plot( df_uupers_slope *ratio_f, 'r--', label='fans'+'*'+str(ratio_f) )
plt.tick_params(
    axis='x',          # changes apply to the x-axis
    which='both',      # both major and minor ticks are affected
    bottom=False,      # ticks along the bottom edge are off
    top=False,         # ticks along the top edge are off
    labelbottom=False) # labels along the bottom edge are off
plt.legend()
plt.show()
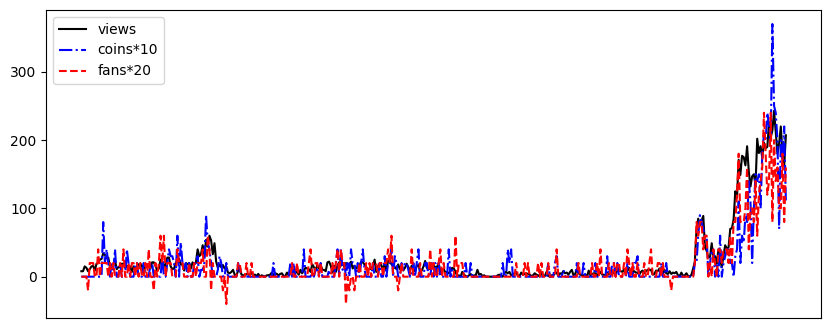
Conclusion for now
The conversion rate from views to coin is about 1/10
The conversion rate from views to fans is about 1/20
74.2. Cross Correlation of Time Series#
The estimations are made by hand. Mathematically, cross correlation tells us about the correlation.
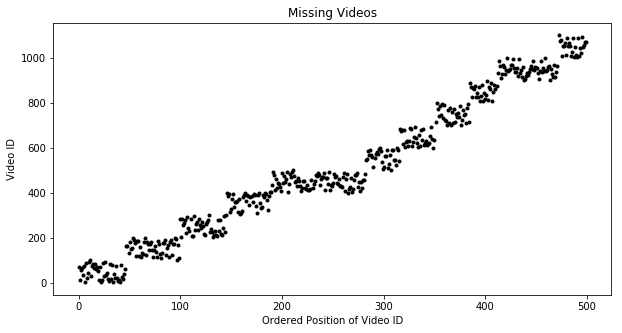
74.3. Missing Videos#
missing_vids_path = "/Users/leima/OneDrive - University of New Mexico/data/mybilividdata/failed_vid_data.csv"
missing_vids = np.genfromtxt(missing_vids_path, delimiter=',')
---------------------------------------------------------------------------
FileNotFoundError                         Traceback (most recent call last)
Cell In[28], line 2
      1 missing_vids_path = "/Users/leima/OneDrive - University of New Mexico/data/mybilividdata/failed_vid_data.csv"
----> 2 missing_vids = np.genfromtxt(missing_vids_path, delimiter=',')

File ~/anaconda3/envs/mini-lab/lib/python3.9/site-packages/numpy/lib/npyio.py:1959, in genfromtxt(fname, dtype, comments, delimiter, skip_header, skip_footer, converters, missing_values, filling_values, usecols, names, excludelist, deletechars, replace_space, autostrip, case_sensitive, defaultfmt, unpack, usemask, loose, invalid_raise, max_rows, encoding, ndmin, like)
   1957     fname = os_fspath(fname)
   1958 if isinstance(fname, str):
-> 1959     fid = np.lib._datasource.open(fname, 'rt', encoding=encoding)
   1960     fid_ctx = contextlib.closing(fid)
   1961 else:

File ~/anaconda3/envs/mini-lab/lib/python3.9/site-packages/numpy/lib/_datasource.py:193, in open(path, mode, destpath, encoding, newline)
    156 """
    157 Open `path` with `mode` and return the file object.
    158
   (...)
    189
    190 """
    192 ds = DataSource(destpath)
--> 193 return ds.open(path, mode, encoding=encoding, newline=newline)

File ~/anaconda3/envs/mini-lab/lib/python3.9/site-packages/numpy/lib/_datasource.py:533, in DataSource.open(self, path, mode, encoding, newline)
    530     return _file_openers[ext](found, mode=mode,
    531                               encoding=encoding, newline=newline)
    532 else:
--> 533     raise FileNotFoundError(f"{path} not found.")

FileNotFoundError: /Users/leima/OneDrive - University of New Mexico/data/mybilividdata/failed_vid_data.csv not found.
plt.figure(figsize=(10,5))
plt.plot(missing_vids[:500:],'k.')
plt.title('Missing Videos')
plt.ylabel('Video ID')
plt.xlabel('Ordered Position of Video ID')
# plt.tick_params(
#     axis='x',          # changes apply to the x-axis
#     which='both',      # both major and minor ticks are affected
#     bottom=False,      # ticks along the bottom edge are off
#     top=False,         # ticks along the top edge are off
#     labelbottom=False) # labels along the bottom edge are off

plt.show()
Calculate missing video rate
def missing_rate(missing_vids_in, start, win):

#     missing_vids_max_f = max(missing_vids)
#     missing_vids_min_f = min( missing_vids_f[start:start+win])
    missing_vids_f = [ i for i in missing_vids_in if (i < start+win)&(i> start) ]


    missing_vids_full_f = [int(i) for i in range(start, start + win)]

#     return len( list( set(missing_vids_full_f) - set(missing_vids_f) ) )/len(missing_vids_full_f)
    return len( missing_vids_f )/win
windowsize = 100000

missing_rate_list = []

missing_data_start = 0
missing_data_flag = missing_data_start
missing_data_end = max(missing_vids)

for i in np.arange(missing_data_start, missing_data_end - windowsize, windowsize ):

    missing_rate_list.append( missing_rate( missing_vids, missing_data_flag, windowsize ) )

    missing_data_flag = missing_data_flag + windowsize
plt.figure(figsize=(10,5))
plt.plot( missing_rate_list, 'k.' )
plt.title('Missing Video Rate')
plt.ylabel('Missing Video Rate')
plt.xlabel('Abstracted Time')
# plt.ylim([0,1])
plt.show()
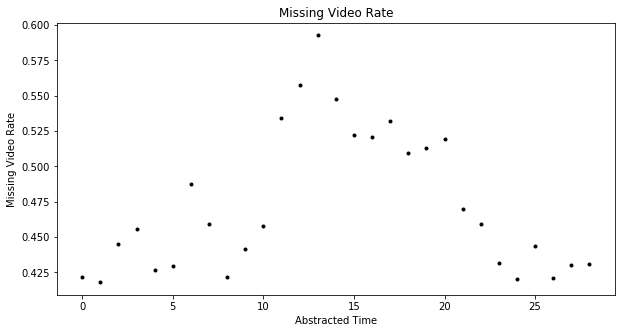
The missing video id data rate is about
np.average(missing_rate_list)
0.4731796551724139
Yet we do not know the reason. It might because the website doesn’t use all vids. It might also because the videos are submitted but deleted.