Scientist Names
Contents
6. Scientist Names#
import pandas as pd
import matplotlib.pyplot as plt
6.1. Get Data#
df_raw = pd.read_json("https://raw.githubusercontent.com/dariusk/corpora/master/data/humans/scientists.json")
df_raw.head()
| description | scientists | |
|---|---|---|
| 0 | List of particularly famous scientists | Aage Bohr |
| 1 | List of particularly famous scientists | Abdul Qadeer Khan |
| 2 | List of particularly famous scientists | Abu Nasr Al-Farabi |
| 3 | List of particularly famous scientists | Ada Lovelace |
| 4 | List of particularly famous scientists | Adalbert Czerny |
6.2. Prepare the dataset#
df = df_raw[ ['scientists'] ].copy()
df['first_name'] = df.scientists.apply( lambda x: x.split(' ')[0] )
df['last_name'] = df.scientists.apply( lambda x: x.split(' ')[-1] )
df['len_diff'] = df.apply( lambda x: len(x.first_name) - len(x.last_name), axis=1 )
df.head()
| scientists | first_name | last_name | len_diff | |
|---|---|---|---|---|
| 0 | Aage Bohr | Aage | Bohr | 0 |
| 1 | Abdul Qadeer Khan | Abdul | Khan | 1 |
| 2 | Abu Nasr Al-Farabi | Abu | Al-Farabi | -6 |
| 3 | Ada Lovelace | Ada | Lovelace | -5 |
| 4 | Adalbert Czerny | Adalbert | Czerny | 2 |
6.3. Plots#
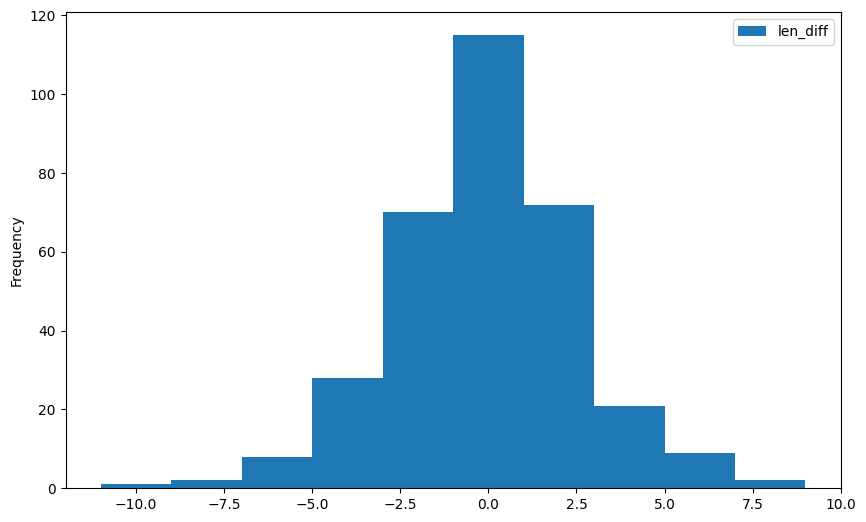
fig, ax = plt.subplots( figsize=(10,6.18) )
df.plot.hist(ax=ax)
<AxesSubplot:ylabel='Frequency'>


