
Error Function
Contents
import numpy as np
import matplotlib.pyplot as plt
def gaussian(x, mu, sigma):
    return np.exp(-(x - mu)**2. / (2 * sigma**2 ))
x=np.linspace(-3,3,10001)
mu_0 = 0
sigma_0 = 1
y=[ gaussian(i, mu_0, sigma_0) for i in x ]
alpha_0 = 0.5
two_sigma = 2 * sigma_0
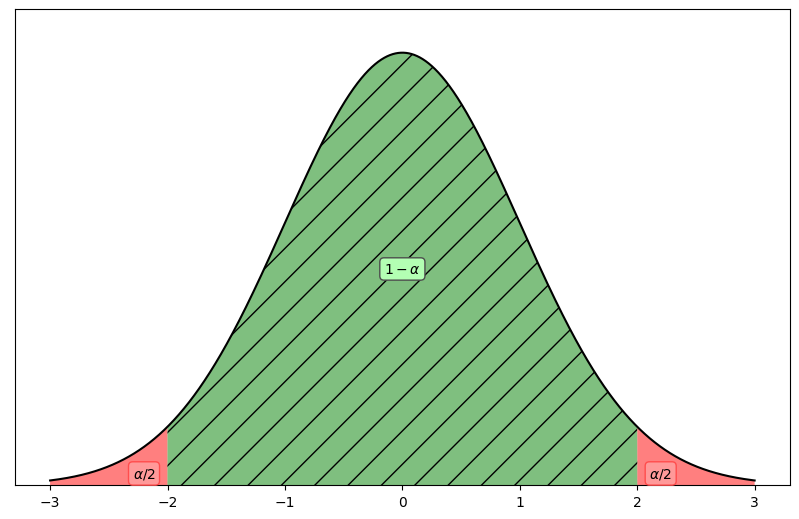
fig, ax = plt.subplots( figsize=(10,6.18) )
ax.plot(x,y, 'k-')
ax.set_ylim([0,1.1])
ax.set_yticks([])
ax.fill_between(x, 0, y, where= ( x < -two_sigma ), facecolor='red', alpha = alpha_0, interpolate=True)
ax.fill_between(x, 0, y, where= ( x > two_sigma ), facecolor='red', alpha = alpha_0, interpolate=True)
ax.fill_between(x, 0, y, where= ( [ (i >= -two_sigma) and (i<=two_sigma) for i in x] ), hatch="/", facecolor='green', alpha = alpha_0, interpolate=True)
ax.text(0, 0.5, r"$1-\alpha$", size=10, rotation=0.,
ha="center", va="center",
bbox=dict(boxstyle="round",
ec=(0.3, 0.3, 0.3),
fc=(0.7, 1, 0.7),
)
)
ax.text(-2.2, 0.01, r"$\alpha/2$", size=10, rotation=0.,
ha="center", va="bottom",
bbox=dict(boxstyle="round",
ec=(1, 0.3, 0.3),
fc=(1., 0.6, 0.6),
)
)
ax.text(2.2, 0.01, r"$\alpha/2$", size=10, rotation=0.,
ha="center", va="bottom",
bbox=dict(boxstyle="round",
ec=(1, 0.3, 0.3),
fc=(1., 0.6, 0.6),
)
)
Text(2.2, 0.01, '$\\alpha/2$')
x=np.linspace(-5,5,10001)
mu_0 = 0
sigma_2 = 2
sigma_1 = 1
y_2 =[ gaussian(i, mu_0, sigma_2) for i in x ]
y_1 = [gaussian(i, mu_0, sigma_1) for i in x ]
alpha_0 = 0.5
two_sigma_1 = 2 * sigma_1
two_sigma_2 = 2 * sigma_2
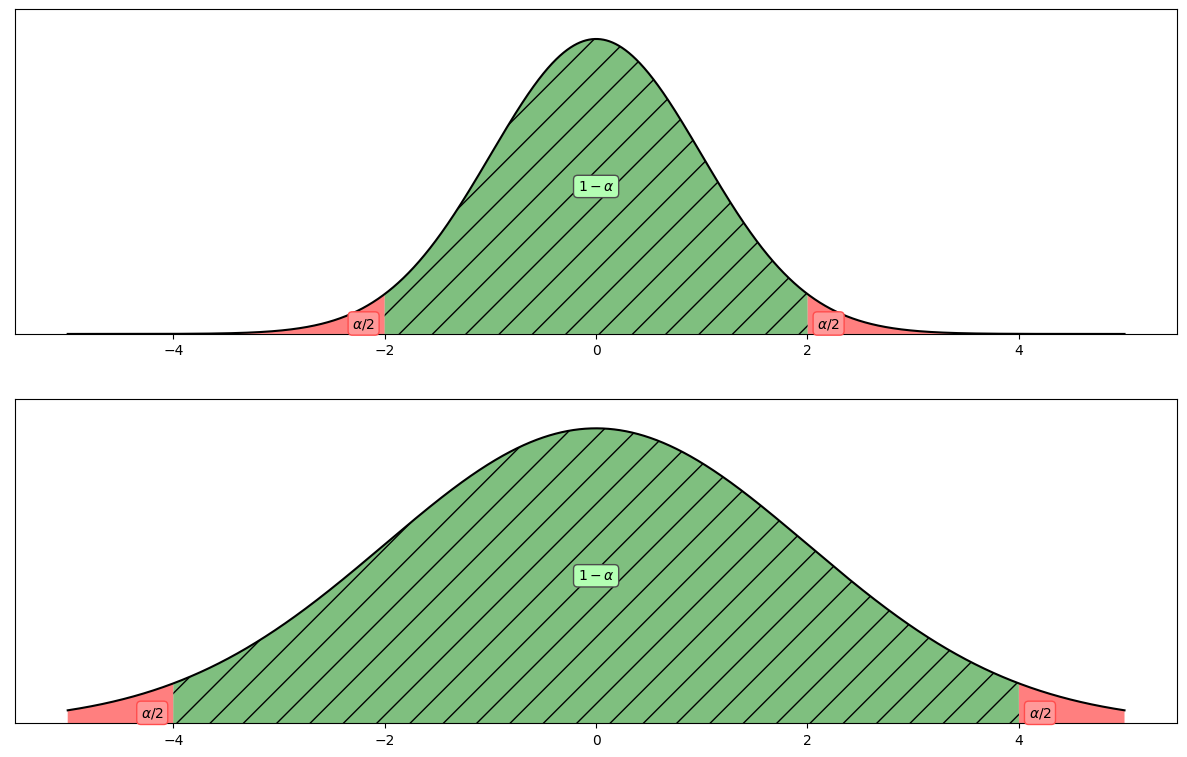
fig, ax = plt.subplots( 2, figsize= (1.5 * 10, 1.5 * 6.18) )
ax[0].plot(x,y_1, 'k-')
ax[0].set_ylim([0,1.1])
ax[0].set_yticks([])
ax[0].fill_between(x, 0, y_1, where= ( x < -two_sigma_1 ), facecolor='red', alpha = alpha_0, interpolate=True)
ax[0].fill_between(x, 0, y_1, where= ( x > two_sigma_1 ), facecolor='red', alpha = alpha_0, interpolate=True)
ax[0].fill_between(x, 0, y_1, where= ( [ (i >= -two_sigma_1) and (i<=two_sigma_1) for i in x] ), hatch="/", facecolor='green', alpha = alpha_0, interpolate=True)
ax[0].text(0, 0.5, r"$1-\alpha$", size=10, rotation=0.,
ha="center", va="center",
bbox=dict(boxstyle="round",
ec=(0.3, 0.3, 0.3),
fc=(0.7, 1, 0.7),
)
)
ax[0].text(-2.2, 0.01, r"$\alpha/2$", size=10, rotation=0.,
ha="center", va="bottom",
bbox=dict(boxstyle="round",
ec=(1, 0.3, 0.3),
fc=(1., 0.6, 0.6),
)
)
ax[0].text(2.2, 0.01, r"$\alpha/2$", size=10, rotation=0.,
ha="center", va="bottom",
bbox=dict(boxstyle="round",
ec=(1, 0.3, 0.3),
fc=(1., 0.6, 0.6),
)
)
ax[1].plot(x,y_2, 'k-')
ax[1].set_ylim([0,1.1])
ax[1].set_yticks([])
ax[1].fill_between(x, 0, y_2, where= ( x < -two_sigma_2 ), facecolor='red', alpha = alpha_0, interpolate=True)
ax[1].fill_between(x, 0, y_2, where= ( x > two_sigma_2 ), facecolor='red', alpha = alpha_0, interpolate=True)
ax[1].fill_between(x, 0, y_2, where= ( [ (i >= -two_sigma_2) and (i<=two_sigma_2) for i in x] ), hatch="/", facecolor='green', alpha = alpha_0, interpolate=True)
ax[1].text(0, 0.5, r"$1-\alpha$", size=10, rotation=0.,
ha="center", va="center",
bbox=dict(boxstyle="round",
ec=(0.3, 0.3, 0.3),
fc=(0.7, 1, 0.7),
)
)
ax[1].text(-4.2, 0.01, r"$\alpha/2$", size=10, rotation=0.,
ha="center", va="bottom",
bbox=dict(boxstyle="round",
ec=(1, 0.3, 0.3),
fc=(1., 0.6, 0.6),
)
)
ax[1].text(4.2, 0.01, r"$\alpha/2$", size=10, rotation=0.,
ha="center", va="bottom",
bbox=dict(boxstyle="round",
ec=(1, 0.3, 0.3),
fc=(1., 0.6, 0.6),
)
)
Text(4.2, 0.01, '$\\alpha/2$')
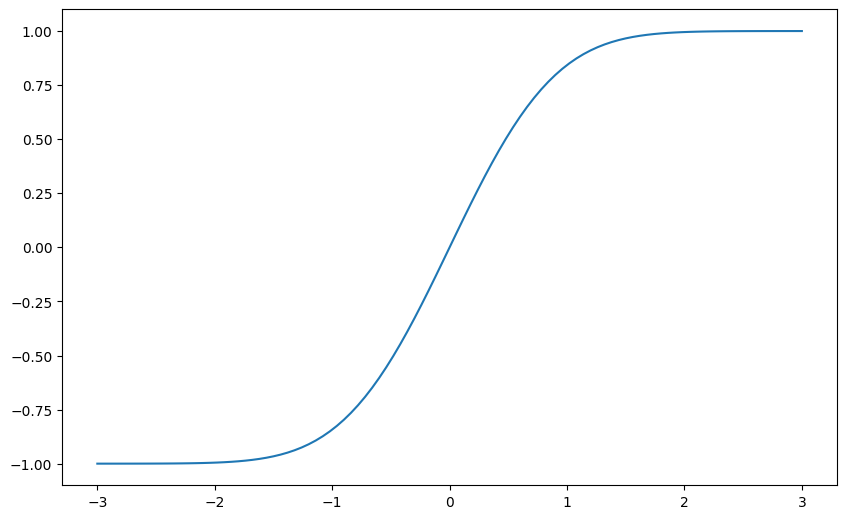
38. Error Function#
import math
erf_x = np.linspace(-3,3, 101)
erf_y = [math.erf( i ) for i in erf_x]
fig, ax = plt.subplots( figsize=(10,6.18) )
ax.plot(erf_x, erf_y)
[<matplotlib.lines.Line2D at 0x7f435072a100>]
39. Some Numbers#
A very intersting