Flight Routes in USA
Contents
8. Flight Routes in USA#
Data: https://openflights.org/data.html
import pandas as pd
import networkx as nx
import matplotlib.pyplot as plt
from mpl_toolkits.basemap import Basemap as Basemap
import matplotlib.lines as mlines
%%bash
ls data
airport_df.csv
airports.dat
routes.dat
routes_df.csv
df_airport = pd.read_csv("data/airport_df.csv")
df_routes = pd.read_csv("data/routes_df.csv")

print(df_routes.columns)
print(df_routes.head())

df_airport = df_airport[(df_airport.Country == "United States") & (df_airport.Lat > 25) & (df_airport.Lat < 50) & (df_airport.Long > -130) & (df_airport.Long < -60)]
print(df_airport.head())

airports_in_us = df_airport['IATA'].values

df_airport_ix = df_airport.index.values
print(df_airport_ix)

df_routes = df_routes[(df_routes['Source Airport ID'].isin(df_airport_ix)) & (df_routes['Dest Airport ID'].isin(df_airport_ix) & df_routes['Source Airport'].isin(airports_in_us)) & (df_routes['Dest Airport'].isin(airports_in_us))]

df_routes =  pd.DataFrame(df_routes.groupby(['Source Airport', 'Dest Airport']).size().reset_index(name='counts'))

counts = df_routes['Source Airport'].append(df_routes.loc[df_routes['Source Airport'] != df_routes['Dest Airport'], 'Dest Airport']).value_counts()

counts = pd.DataFrame({'IATA': counts.index, 'total_flight': counts})

pos_data = counts.merge(df_airport, on = 'IATA')
pos_data.to_csv("data/pos_data.csv",sep=",")
Index(['Unnamed: 0', 'Airline', 'Airline ID', 'Source Airport',
       'Source Airport ID', 'Dest Airport', 'Dest Airport ID', 'Codeshare',
       'Stops', 'equipment'],
      dtype='object')
   Unnamed: 0 Airline Airline ID Source Airport  Source Airport ID  \
0           0      2B        410            AER             2965.0
1           1      2B        410            ASF             2966.0
2           2      2B        410            ASF             2966.0
3           3      2B        410            CEK             2968.0
4           4      2B        410            CEK             2968.0

  Dest Airport  Dest Airport ID Codeshare  Stops equipment
0          KZN           2990.0       NaN      0       CR2
1          KZN           2990.0       NaN      0       CR2
2          MRV           2962.0       NaN      0       CR2
3          KZN           2990.0       NaN      0       CR2
4          OVB           4078.0       NaN      0       CR2
        ID                       Name        City        Country IATA  ICAO  \
3204  3416  Orlando Executive Airport     Orlando  United States  ORL  KORL
3213  3425   Laurence G Hanscom Field     Bedford  United States  BED  KBED
3220  3432   Oscoda Wurtsmith Airport      Oscoda  United States  OSC  KOSC
3221  3433   Marina Municipal Airport    Fort Ord  United States  OAR  KOAR
3222  3434  Sacramento Mather Airport  Sacramento  United States  MHR  KMHR

            Lat        Long  Alt Timezone DST Tz database time zone     type  \
3204  28.545500  -81.332901  113       -5   A      America/New_York  airport
3213  42.470001  -71.289001  133       -5   A      America/New_York  airport
3220  44.451599  -83.394096  633       -5   A      America/New_York  airport
3221  36.681900 -121.762001  137       -8   A   America/Los_Angeles  airport
3222  38.553902 -121.297996   98       -8   A   America/Los_Angeles  airport

           source
3204  OurAirports
3213  OurAirports
3220  OurAirports
3221  OurAirports
3222  OurAirports
[3204 3213 3220 ... 6996 6997 6998]
df_airport[ df_airport['IATA'] =='AAT' ]
| ID | Name | City | Country | IATA | ICAO | Lat | Long | Alt | Timezone | DST | Tz database time zone | type | source |
|---|
df_routes[ df_routes['Source Airport'] =='AAT' ]
| Source Airport | Dest Airport | counts |
|---|
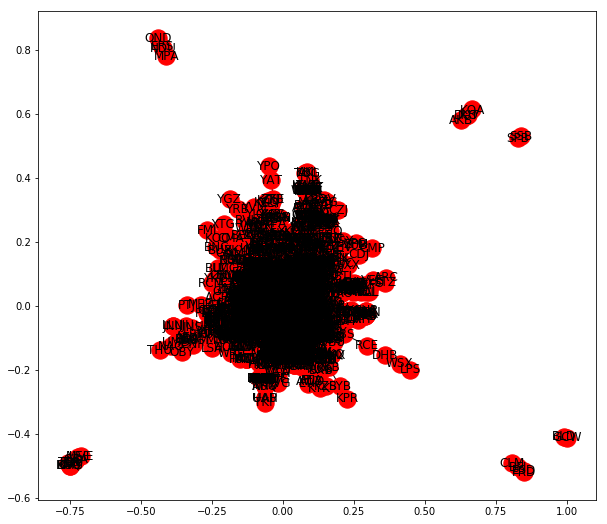
graph = nx.from_pandas_edgelist(df_routes, 'Source Airport', 'Dest Airport', edge_attr=True)
plt.figure(figsize = (10,9))
nx.draw_networkx(graph)
# plt.savefig("./images/map_0.png", format = "png", dpi = 300)
plt.show()

plt.figure(figsize = (10,9))
m = Basemap(projection='merc',llcrnrlon=-180,llcrnrlat=10,urcrnrlon=-50,urcrnrlat=70, lat_ts=0, resolution='l',suppress_ticks=True)
<Figure size 720x648 with 0 Axes>
# pos_data = pd.read_csv("data/pos_data.csv")
# pos_data = pos_data.drop(['Unnamed: 0'],axis=1);

# pos_aer = pd.DataFrame([['AER', 0, '' , 43.4450,39.9439, ''],['KZN', 0, '' , 55.6086, 49.2984,''], ['ASF', 0, '' , 46.2870, 47.9999,''], ['MRV', 0, '' , 44.2178, 43.0877,''] ],columns = ['IATA', 'total_flight', 'Name', 'Lat', 'Long', 'ICAO'])
# pos_data = pd.concat([pos_aer,pos_data])
pos_data[pos_data['IATA'] == 'AAT']
| IATA | total_flight | ID | Name | City | Country | ICAO | Lat | Long | Alt | Timezone | DST | Tz database time zone | type | source |
|---|
mx, my = m(pos_data['Long'].values, pos_data['Lat'].values)
pos = {}
for count, elem in enumerate (pos_data['IATA']):
     pos[elem] = (mx[count], my[count])
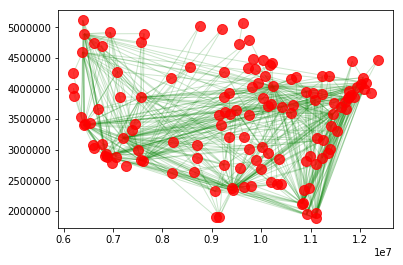
nx.draw_networkx_nodes(G = graph, pos = pos, node_list = graph.nodes(),node_color = 'r', alpha = 0.8, node_size = 100)
nx.draw_networkx_edges(G = graph, pos = pos, edge_color='g', alpha=0.2, arrows = False)
<matplotlib.collections.LineCollection at 0x10d67ada0>

crit = 90
graph = nx.from_pandas_edgelist(df_routes, source = 'Source Airport', target = 'Dest Airport', edge_attr = 'counts',create_using = nx.DiGraph())

# Set up base map
plt.figure(figsize=(15,20))
m = Basemap(
        projection='merc',
        llcrnrlon=-130,
        llcrnrlat=25,
        urcrnrlon=-60,
        urcrnrlat=50,
        lat_ts=0,
        resolution='l',
        suppress_ticks=True)

# import long lat as m attribute
mx, my = m(pos_data['Long'].values, pos_data['Lat'].values)
pos = {}
for count, elem in enumerate (pos_data['IATA']):
    pos[elem] = (mx[count], my[count])

# draw nodes and edges and overly on basemap
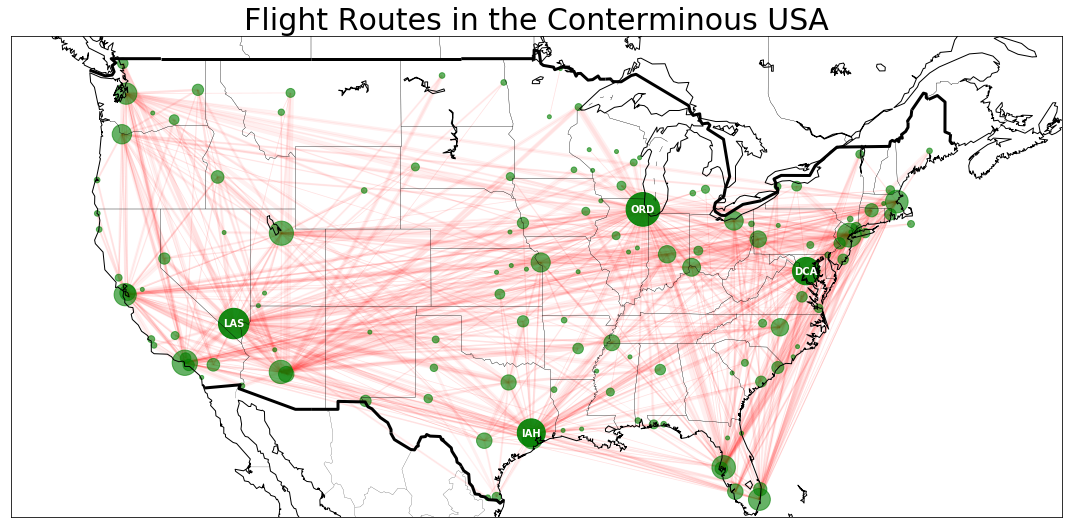
nx.draw_networkx_nodes(G = graph, pos = pos, nodelist = [x for x in graph.nodes() if counts['total_flight'][x] >= crit],
                       node_color = 'g', alpha = 0.9,
                       node_size = [counts['total_flight'][x]*8  for x in graph.nodes() if counts['total_flight'][x] >= crit])

nx.draw_networkx_labels(G = graph, pos = pos, font_size=10, font_color = 'w', font_weight='bold',
                        labels = {x:x for x in graph.nodes() if counts['total_flight'][x] >= crit})

nx.draw_networkx_nodes(G = graph, pos = pos, nodelist = [x for x in graph.nodes() if counts['total_flight'][x] < crit],
                       node_color = 'g', alpha = 0.6,
                       node_size = [counts['total_flight'][x]*8  for x in graph.nodes() if counts['total_flight'][x] < crit])

nx.draw_networkx_edges(G = graph, pos = pos, edge_color = 'r', width = routes_us['counts']*0.75, alpha=0.06, arrows = False)

m.drawcountries(linewidth = 3)
m.drawstates(linewidth = 0.2)
m.drawcoastlines(linewidth=1)
# m.fillcontinents(alpha = 0.3)
line1 = mlines.Line2D(range(1), range(1), color="white", marker='o', markerfacecolor="red")
line2 = mlines.Line2D(range(1), range(1), color="white", marker='o',markerfacecolor="blue")
line3 = mlines.Line2D(range(1), range(1), color="green", marker='',markerfacecolor="green")
# plt.legend((line1, line2, line3), ('Large Airport > '+ str(crit) +' routes', 'Smaller airports', 'routes'), loc=4, fontsize = 'xx-large')
# plt.legend((line1, line2, line3), ('Large Airport > '+ str(crit) +' routes', 'Smaller airports', 'routes'), loc=4, fontsize = 'xx-large')
plt.title("Flight Routes in the Conterminous USA", fontsize = 30)


plt.tight_layout()
# plt.savefig("./images/networkx_basemap/map_3.png", format = "png", dpi = 300)
plt.show()


