
Growth Function and VC Dimension
60. Growth Function and VC Dimension#
import numpy as np
import matplotlib.pyplot as plt
import seaborn as sns;sns.set()
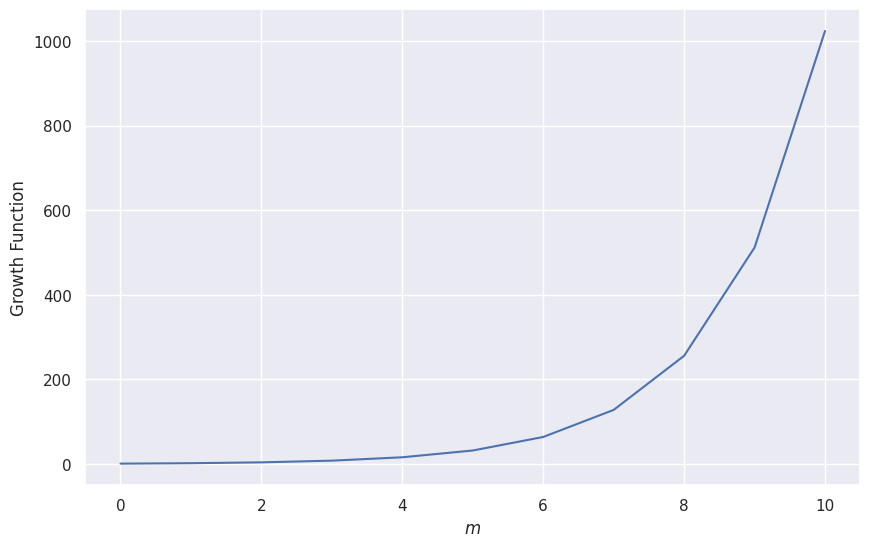
x = np.linspace(0, 10, 11)
y_max = 2**x
fig, ax = plt.subplots(figsize=(10, 6.18))

ax.plot(x, y_max)
# ax.set_yscale("log")

ax.set_xlabel(r"$m$")
ax.set_ylabel("Growth Function")
Text(0, 0.5, 'Growth Function')
 Created in Deepnote