
ANOVA
Contents
42. ANOVA#
ANOVA = Analysis of variance
import numpy as np
import matplotlib.pyplot as plt
import scipy.stats as stats
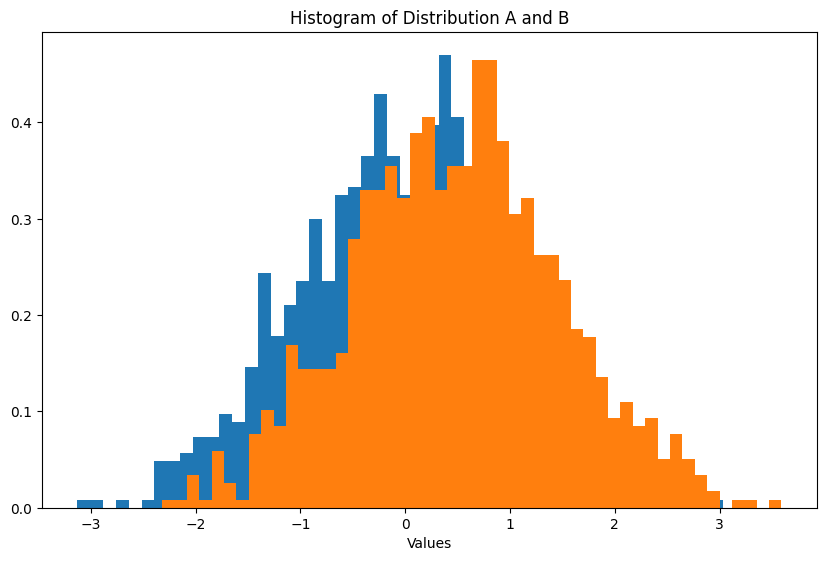
42.1. Test on Two Gaussians#
Generate Gaussian data
a_dist = np.random.normal(loc=0, scale=1, size=1000)
b_dist = np.random.normal(loc=0.5, scale=1, size=1000)
fig, ax = plt.subplots(figsize=(10, 6.18))
ax.hist(a_dist, bins=50, density=True)
ax.hist(b_dist, bins=50, density=True)
ax.set_xlabel("Values")
ax.set_title("Histogram of Distribution A and B")
plt.show()
One-way ANOVA
stats.f_oneway(a_dist,
               b_dist)
F_onewayResult(statistic=120.15423777326816, pvalue=3.4231303945328154e-27)