Correlations in Statistics
%load_ext autoreload
%autoreload 2
40. Correlations in Statistics#
import numpy as np
import pandas as pd
import matplotlib.pyplot as plt
from functions.correlations import CorrelationDataFaker
x = np.linspace(0,100,101)
data_faker = CorrelationDataFaker(x)
fake_dataset = data_faker._curves()
fake_dataset.keys()
dict_keys(['linear+1', 'linear-1', 'vertical', 'flat', 'concave', 'convex'])
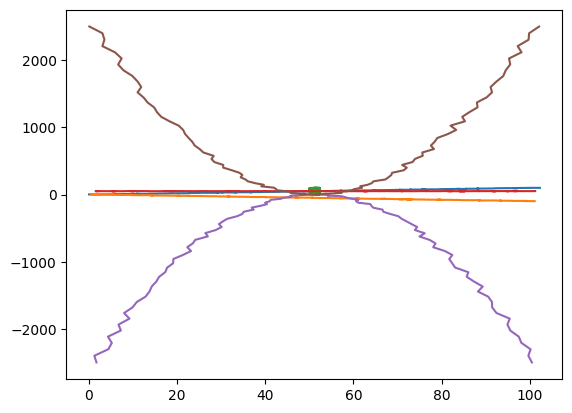
for name, val in fake_dataset.items():
    print(name)
    plt.plot(
        val.get('x'),
        val.get('y')
    )
linear+1
linear-1
vertical
flat
concave
convex
import scipy.stats as ss
for name, val in fake_dataset.items():
    print(name)
    tau, p_value = ss.kendalltau(val.get('x'), val.get('y'))
    print(tau, p_value)
linear+1
0.9853465346534657 2.7837608674822687e-48
linear-1
-0.9861386138613862 2.3433304310682572e-48
vertical
-0.13069306930693073 0.05279731236116984
flat
0.02534653465346535 0.7072305088262179
concave
-0.0015841584158415845 0.9812724675043694
convex
-0.0019801980198019807 0.9765917935035421
for name, val in fake_dataset.items():
    print(name)
    pearsonr, p_value = ss.pearsonr(val.get('x'), val.get('y'))
    print(tau, p_value)
linear+1
-0.0019801980198019807 3.199669606003888e-141
linear-1
-0.0019801980198019807 7.480257761914623e-143
vertical
-0.0019801980198019807 0.0977028378466118
flat
-0.0019801980198019807 0.692383901508831
concave
-0.0019801980198019807 0.9871235063542195
convex
-0.0019801980198019807 0.992932902850725
from functions.correlations import cramers_v
Since the numbers only apprear once and we do not
for name, val in fake_dataset.items():
    print(name)
    cramers = cramers_v(
        np.array(val.get('x')),
        np.array(val.get('y'))
                )
    print(cramers)
linear+1
nan
linear-1
nan
vertical
nan
flat
nan
concave
nan
convex
nan
/home/runner/work/mini-lab/mini-lab/notebooks/statistics/functions/correlations.py:21: RuntimeWarning: invalid value encountered in scalar divide
  return np.sqrt(phi2corr/min((kcorr-1),(rcorr-1)))
/home/runner/work/mini-lab/mini-lab/notebooks/statistics/functions/correlations.py:21: RuntimeWarning: invalid value encountered in scalar divide
  return np.sqrt(phi2corr/min((kcorr-1),(rcorr-1)))
/home/runner/work/mini-lab/mini-lab/notebooks/statistics/functions/correlations.py:21: RuntimeWarning: invalid value encountered in scalar divide
  return np.sqrt(phi2corr/min((kcorr-1),(rcorr-1)))
/home/runner/work/mini-lab/mini-lab/notebooks/statistics/functions/correlations.py:21: RuntimeWarning: invalid value encountered in scalar divide
  return np.sqrt(phi2corr/min((kcorr-1),(rcorr-1)))
/home/runner/work/mini-lab/mini-lab/notebooks/statistics/functions/correlations.py:21: RuntimeWarning: invalid value encountered in scalar divide
  return np.sqrt(phi2corr/min((kcorr-1),(rcorr-1)))
/home/runner/work/mini-lab/mini-lab/notebooks/statistics/functions/correlations.py:21: RuntimeWarning: invalid value encountered in scalar divide
  return np.sqrt(phi2corr/min((kcorr-1),(rcorr-1)))
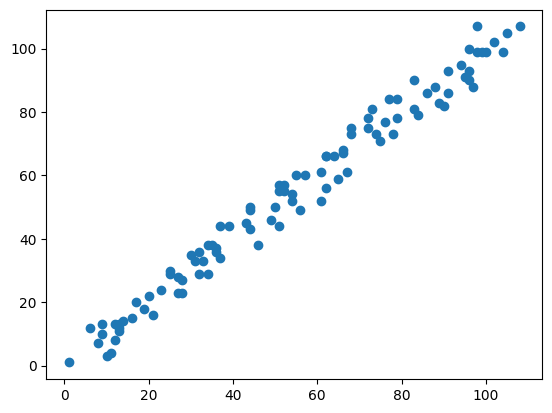
x_test, y_test = np.random.randint(10, size=100), np.random.randint(10, size=100)
x_test = [val + idx for idx, val in enumerate(x_test)]
y_test = [val + idx for idx, val in enumerate(y_test)]
cramers_v(x_test, y_test)
0.3021882426404902
plt.scatter(x_test, y_test)
<matplotlib.collections.PathCollection at 0x7eff3bbc7460>