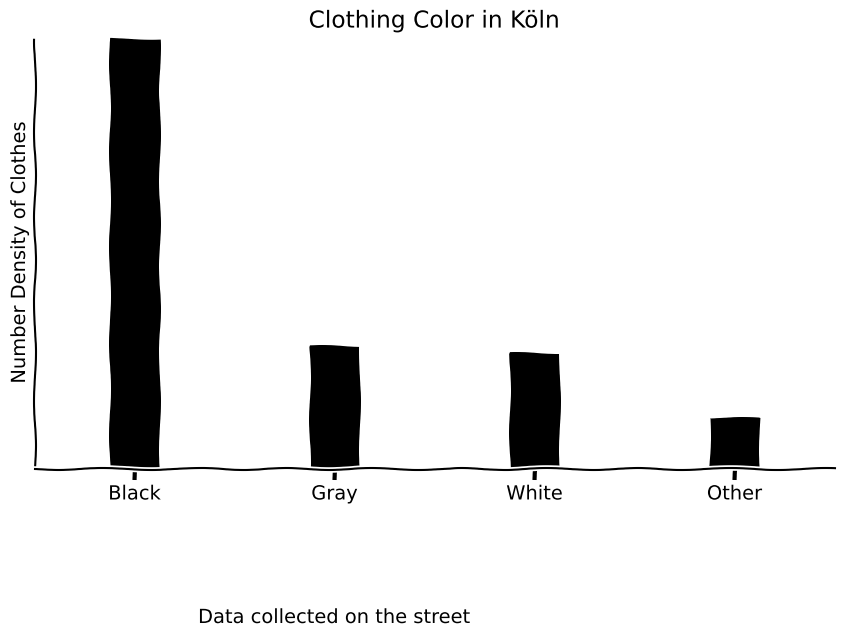
with plt.xkcd():
    # Based on "The Data So Far" from XKCD by Randall Monroe
    # http://xkcd.com/373/

    fig = plt.figure(figsize=(10, 6.18))
    ax = fig.add_axes((0.2, 0.2, 0.8, 0.7))
    ax.bar([0, 1,2,3], [60, 17,16, 7], 0.25, color="k")
    ax.spines['right'].set_color('none')
    ax.spines['top'].set_color('none')
    ax.xaxis.set_ticks_position('bottom')
    ax.yaxis.set_ticks_position('left')
    ax.set_xticks([0, 1, 2, 3])
    ax.set_xlim([-0.5, 3.5])
    ax.set_ylim([0, 60])
    ax.set_xticklabels(['Black', 'Gray', 'White', 'Other'])
    ax.set_ylabel('Number Density of Clothes')
    plt.yticks([])

    plt.title("Clothing Color in Köln")

    fig.text(
        0.5, -0.05,
        'Data collected on the street',
        ha='center')

plt.show()


