
Some Interesting Graphs
Contents
51. Some Interesting Graphs#
import matplotlib.pyplot as plt
import networkx as nx
import numpy as np
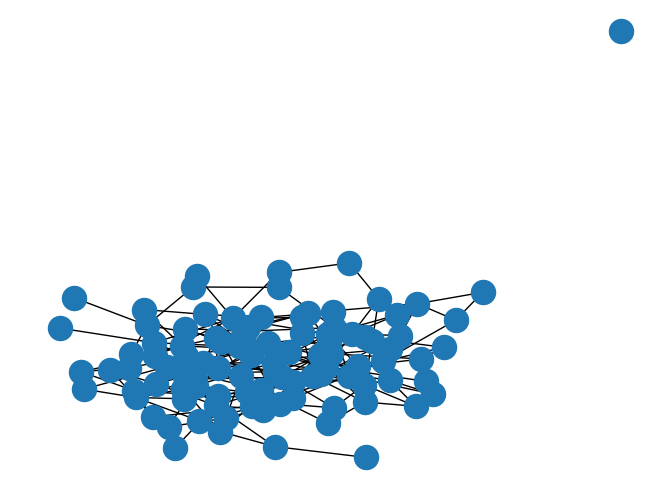
51.1. ER#
https://networkx.org/documentation/stable/auto_examples/graph/plot_erdos_renyi.html
n = 100 # 10 nodes
m = 200 # 20 edges
seed = 42 # seed random number generators for reproducibility
# Use seed for reproducibility
G = nx.gnm_random_graph(n, m, seed=seed)
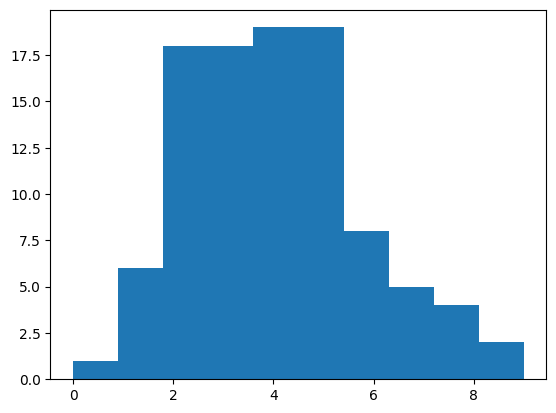
er_degrees = []
for v in nx.nodes(G):
er_degrees.append(nx.degree(G, v))
pos = nx.spring_layout(G, seed=seed) # Seed for reproducible layout
nx.draw(G, pos=pos)
plt.show()
fig, ax = plt.subplots()

ax.hist(er_degrees)
(array([ 1.,  6., 18., 18., 19., 19.,  8.,  5.,  4.,  2.]),
 array([0. , 0.9, 1.8, 2.7, 3.6, 4.5, 5.4, 6.3, 7.2, 8.1, 9. ]),
 <BarContainer object of 10 artists>)
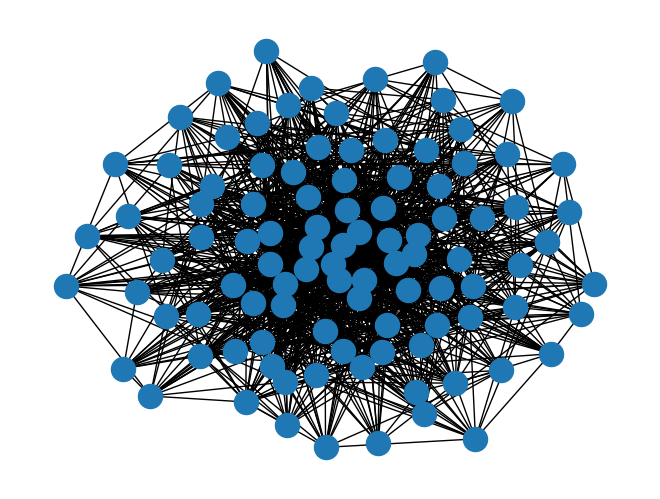
52. PA#
n = 100 # 10 nodes
m = 15 # 20 edges
seed = 42 # seed random number generators for reproducibility
# Use seed for reproducibility
G_pa = nx.generators.random_graphs.barabasi_albert_graph(n, m, seed=seed)
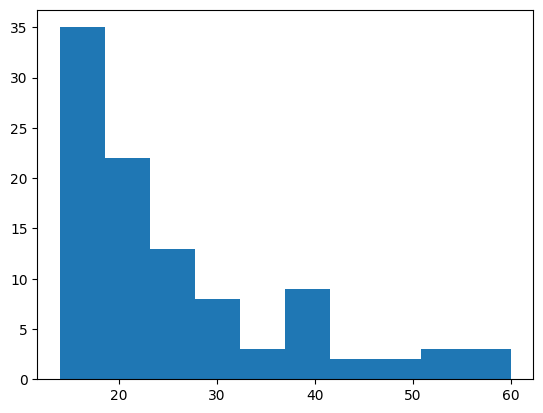
# some properties
pa_degrees = []
for v in nx.nodes(G_pa):
pa_degrees.append(nx.degree(G_pa, v))
pos = nx.spring_layout(G_pa, seed=seed) # Seed for reproducible layout
nx.draw(G_pa, pos=pos)
plt.show()
fig, ax = plt.subplots()

ax.hist(pa_degrees)
(array([35., 22., 13.,  8.,  3.,  9.,  2.,  2.,  3.,  3.]),
 array([14. , 18.6, 23.2, 27.8, 32.4, 37. , 41.6, 46.2, 50.8, 55.4, 60. ]),
 <BarContainer object of 10 artists>)
 Created in Deepnote